
Housing never less affordable

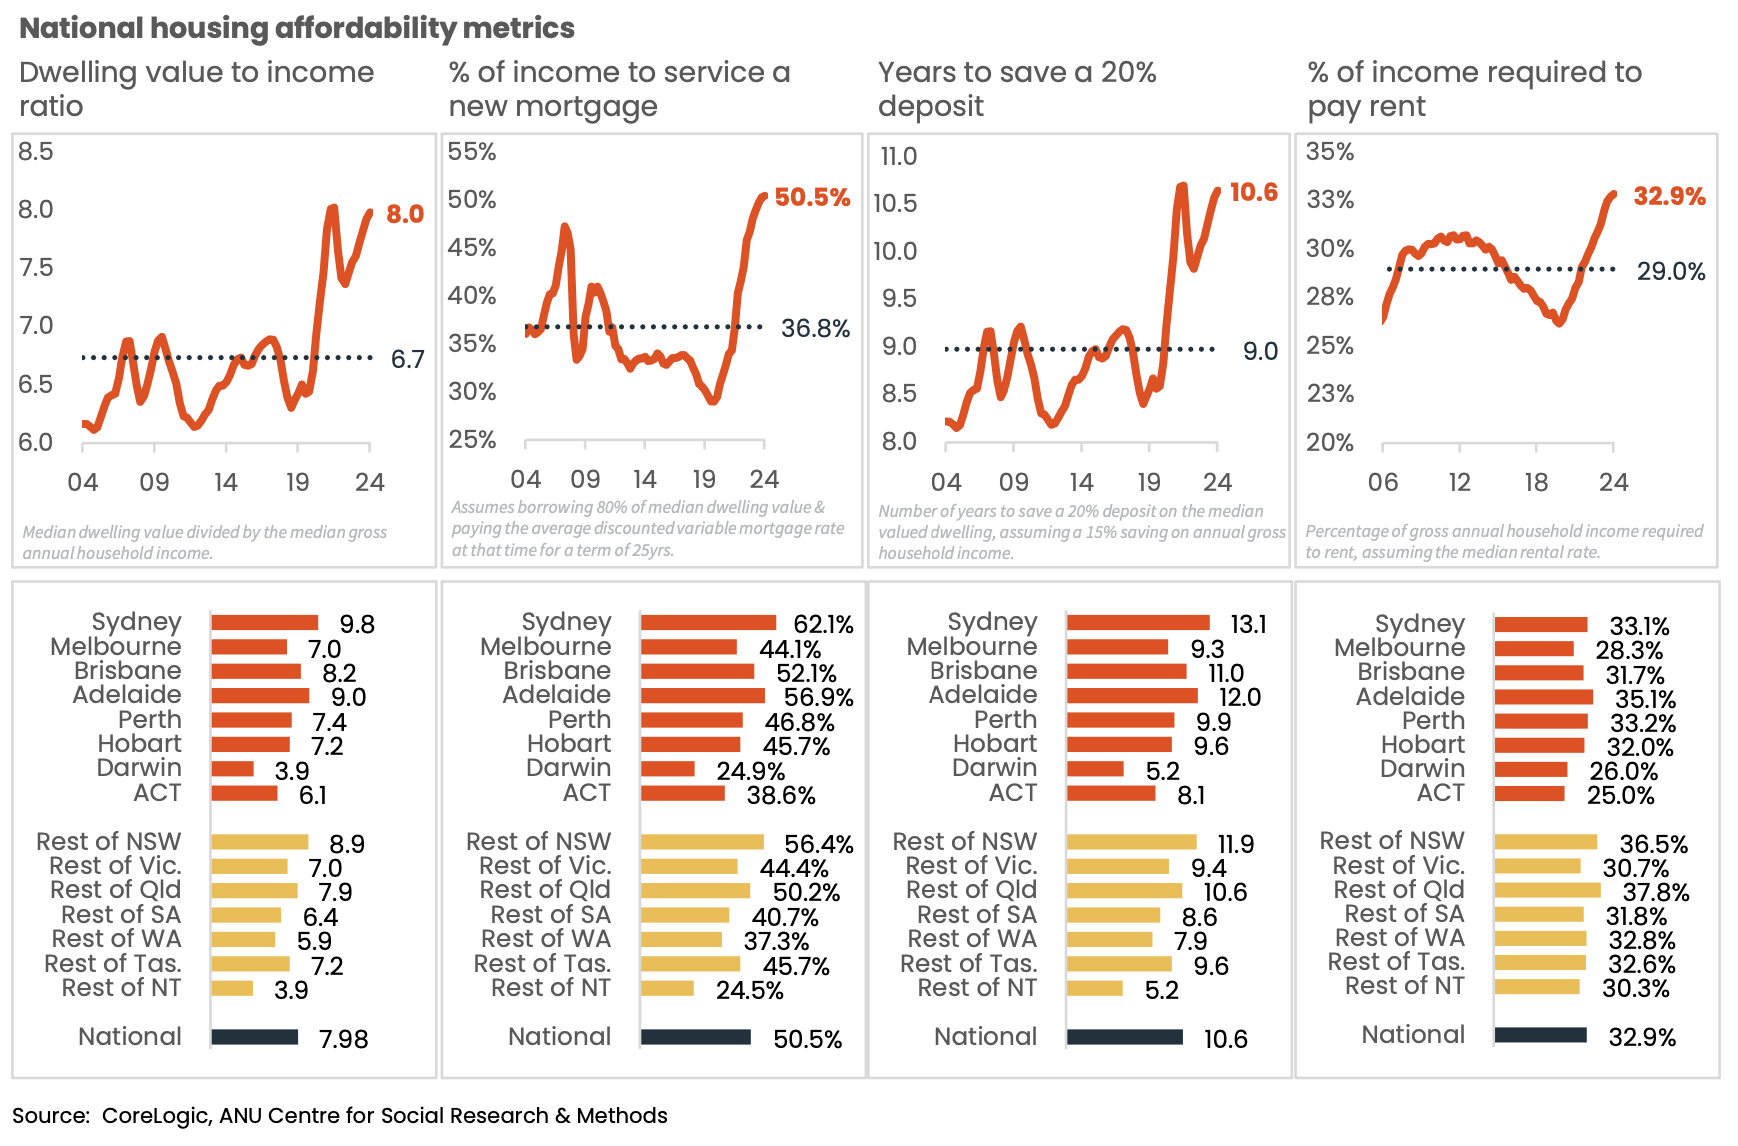
New analysis from CoreLogic has confirmed why housing affordability is a major election issue – by most measures housing has never been less affordable.
The CoreLogic data, released today, states that the company produces four different measures of housing affordability, and each of them was either equal to or at a new record for unaffordability at the end of 2024.
Nationally, the ratio of dwelling values to household incomes has been above 6 consistently since 2003, reaching a record high in 2022 and again in December 2024 at 8.0. A ratio of 8 means a household on the median income would be spending eight times their annual gross income to purchase the median value dwelling.
It said that, similarly, based on serviceability metrics for a new mortgage, the median income household would require more than 30% of their gross income for mortgage repayments on the median dwelling value since 2002. The only respite was in 2020, when interest rates fell to emergency lows and housing values hadn’t yet rocketed higher. In December, a median-income household purchasing the median value dwelling with a 20% deposit would be dedicating just over half their gross annual income to mortgage repayments.
The analysis said it is also taking a record number of years to save for a 20% deposit at 10.6 years, assuming a household can save 15% of their income, which is a major challenge when cost of living pressures have been high. To make matters worse, rental affordability has never been this stretched, with rental households requiring roughly one third of their income to pay rent.
“Geographically, Sydney stands out with the most severe levels of housing unaffordability, apart from rental affordability, where Adelaide is the most stretched. At the other end of the spectrum is Darwin, where a more balanced level of demand and supply has kept housing relatively affordable,” the analysis said.
As of December, the most unaffordable electorates to buy a home are mostly located in Sydney, with 4 of the top 5 and 12 of the top 20 most unaffordable electorates.
The list was topped by the electorate of Bradfield, which includes the North Sydney and Hornsby region, with a dwelling value to income ratio of 16.5. Bradfield has recorded the highest dwelling value to income ratio of any electorate consistently since the final quarter of 2018, and prior to that was ranked either number one or two nationally since 2013.
While the electorate of Wentworth (ranked 12th most unaffordable) is home to more expensive suburbs, such as Bellevue Hill and Vaucluse, and has a slightly lower median income than across the Bradfield electorate. However, it’s also an electorate with much higher housing density. In the Wentworth electorate, 69% of dwellings are classified as units, compared with just 40% of housing in Bradfield. It’s a timely reminder about the affordability benefits that a diverse range of housing stock can provide.
Outside of Sydney, Regional NSW and Regional Qld both accounted for three electorates in the top 20, with Richmond recording the highest dwelling value to income ratio. Richmond, located in northern NSW and including high-profile coastal markets like Byron Bay, recorded a dwelling value to income ratio of 12.4, the highest of any regional market nationally. Before the pandemic, the electorate of Richmond was ranked 21st most unaffordable nationally, however, significant value growth through the pandemic saw affordability metrics across most lifestyle markets worsen substantially, with Richmond now ranked the 5th most unaffordable electorate nationally to purchase a home.








LOL - the current number isn't the floor. It's just a pause as more declines are incoming tks to insane…
Someone is fudging the numbers on the number of active advisers available to provide advice! While there may be in…
When they leave a licensee they come off the list. When they commence with a new one they come back…
You have a reversal in number. 15203 and another 15023…
How does an adviser shifting licensees add to a new adviser list ?